Redistricting
In the US, the people are represented in Congress by representatives elected by the people of their state. Each state is partitioned into several congressional districts, and one representative is elected from each district. These congressional districts are also used when the state is distributing money for schools, infrastructure, social programs, and more.
Every 10 years, after the decennial national census, the congressional district borders in every state are redrawn in a process known as redistricting. There are many criteria that those in charge of the redistricting process use when redrawing the congressional district lines, including
equal population in each district,
shapes of the districts,
political lean of each district,
majority minority districts to ensure representation of the minority.
In this project we will focus on the first three of these criteria.
Equal population
In order to guarantee that each person gets equal representation, each representative sent to Congress should be representing the same number of persons. This means that a “good” district map should have districts with equal population. For our model, we will assume that each “census block” has exactly the same population, which leads to the simplification that the population of a district is equal to its area.
To measure how equally distributed the population is, we can calculate the standard deviation from the mean of the areas.
District shapes
Another desireable quality for congressional district maps is for the districts to have a “regular” shape. Consider the following district map, and notice the shape of the district labeled 19.
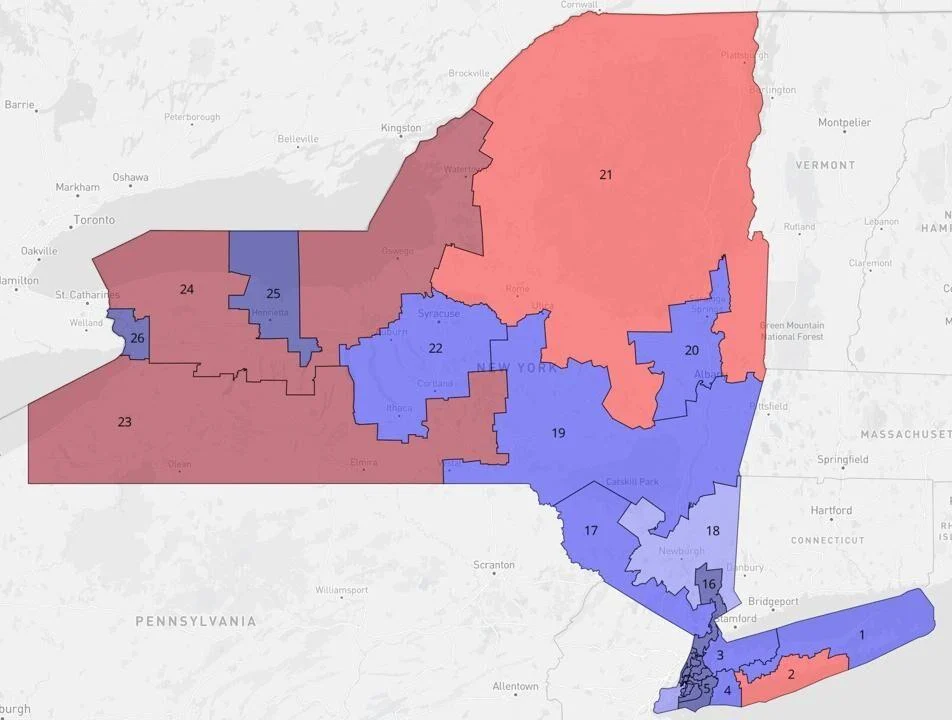
This district does not have a “regular” shape. The more “centralized” (circular) a district is, the better.
To measure how regularly shaped the districts are, we can calculate the perimeter-area ratio (PAR) of each district and then calculate the average variance from the ideal. The shape with the lowest PAR is a circle with a value of
where \(\bar A\) is the average area of the districts. The average variance is
Political lean
A major problem with drawing district maps is that it is often done in order to favor one political party over another. This is called “gerrymandering” and is accomplished by using two methods to cheat the system: “cracking” and “packing”. Cracking is when an area with a high concentration of people who favor the opposing party is split into two or more districts in order to dilute their political power. Packing is when disparate communities are packed into an oddly shaped district in order to concentrate the political power of the opposing party into only one district.
To measure how well the map represents the political make up of the state, we can calculate the percent difference
where \(lean_{map}\) is the percentage of districts that favors party A and \(lean_{state}\) is the percentage of the population that favors party A.
Scoring a district map
For any given map, there is an astromonically large number of possible ways to draw the district borders, but not all of these are “good”, in fact most of them are quite bad. To compare different maps, We will assign a numerical score to each district map.
In reality, the way a map is scored can be very complicated due to all the factors taken into account. We have made several simplifying assumptions so that our score comes down to three terms:
where \(\alpha\) and \(\beta\) are regularizing factors so that each term is between 0 and 1. For this score, a smaller value close to zero is better.
Automating redistricting
The goal of this project is to write code that can model the redistricting process using the criteria listed above. In particular, we will go from a starting map to an acceptable district map by making changes that will decrease the map score in the long term.
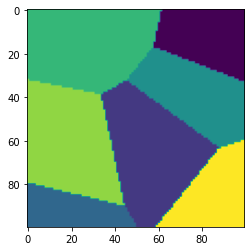
Our maps will consist of a \(n \times n\) array of census blocks, each treated as having population 1. The districts will be made up of groups of neighboring blocks with the same array value. Below is an example of what this might look like with a 100x100 map of 7 districts.
You will be given a map containing voter information for each census block in the form of an array of 0s and 1s. A census block with a value of 1 indicates that it favors party A, and a block with value 0 favors party B.
Exercise: Write a function that will generate a starting district map of a given size and with a given number of districts. Remember that the districts should have as close to the same population as possible.
Exercise: Write a function that will calculate the map score of an given district map with given political lean.
Monte carlo simulation
A monte carlo simulation is a mathematical modeling technique where the state of a dynamical system (system that changes over time) is updated to a new state by randomly choosing from the collection of all the possible states based on the current state.
For this project, we will update the district map by randomly flipping a border block from the largest district to one of its neighbors. This is effectively choosing at random a new map that differs from the current map in only one block.
Markov Chain
A Markov chain is a sequence of states of a dynamical system where each state is generated from the previous based on a set of stocastic rules (based on probability).
Once a new district map is selected, the new map and the old map will be scored, and the scores compared. If the new map has a better score (lower), we will keep it. If the old map has the better score, we will flip a coin to decide whether or not to keep the new map, despite its worse score.
We are effectively trying to minimize the map score, but we do not want to settle for a local minimum. The reason for using a Markov chain is to avoid getting stuck at a local maximum by giving a way of escaping by passing a probability test.
Exercise: Write a function that will update a given district map based on the rules described above.
Project
This is a coding project, so there will be no narrative grade. The grade breakdown is 70% code and 30% presentation.
Your task is to use your assigned vote map in order to generate a district map containing 5 districts that adheres to the criteria set forth in the above description. To figure out which map you will use, in the a code cell at the top of your notebook type (your PN)%31. The maps are included below as black and white PNG files. Download the file and load it into Jupyter. Remember that when you do so, it will come as a 3D array.
You may simulate the redistricting process by animating the Markov chain using the following code.
%matplotlib notebook
from matplotlib.animation import FuncAnimation

dist_map = GenerateDistrictMap(size,num_districts)

fig = plt.figure(figsize = (5,5))
ax = plt.subplot(111)
im = ax.imshow(dist_map)

def animate(i):
    global dist_map

    dist_map = UpdateDistrictMap(dist_map,vote_map,alpha)
    im.set_data(dist_map)
    return im

anim = FuncAnimation(fig=fig, func=animate, interval=100, blit=True, repeat=False)
plt.show()
Extra Credit 1: To make the simulation more realistic, allow the blocks to have different populations, and update your map score calculation accordingly.
Extra Credit 2: Add into your model a way to guarantee at least one majority minority district based on a demographic map.
Extra Credit 3: Another way to measure the shape of a district is to use the centering metric. This metric calculates the center of the district and takes the standard deviation of distance from the center of each block in the district. Include this metric in your map score. Be sure to calibrate using centering metric of a circle with area equal to that of the average district in your map.